
ENGINEERSCOMPASS / PROGRAM CURRICULUM
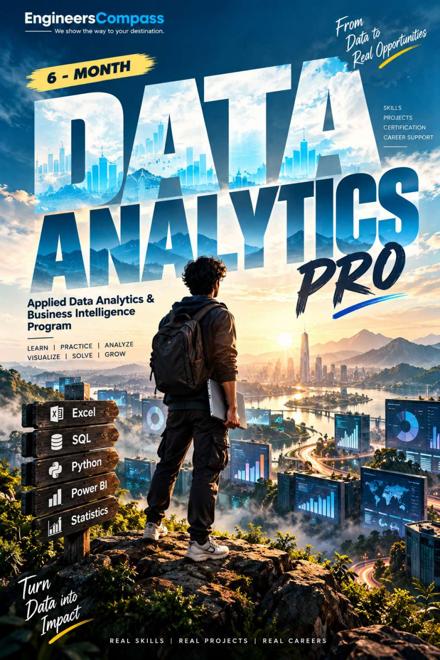
Data Analytics ProApplied data analytics & business intelligence
Move from raw data to useful answers. Practise analysis, dashboards and business storytelling with Excel, SQL, Python and Power BI.
A practical learning journey. A portfolio you can explain with confidence.
THE LEARNING JOURNEY
From foundations.
To putting it into practice.
Explore the topics, guided practice and projects in your curriculum.
01Month 1 · Analytics foundations and Excel
- Week 1: Analyst roles, structured/unstructured data, analytics lifecycle, descriptive/diagnostic/predictive/prescriptive analysis, KPIs, data quality and sources.
- Week 2: Tables, sorting/filtering, conditional formatting, validation, IF/SUMIF/COUNTIF/AVERAGEIF, XLOOKUP/VLOOKUP, INDEX/MATCH, text/date functions and PivotTables.
- Week 3: Samples/populations, averages, variance, standard deviation, percentiles, distributions, outliers, correlation, covariance, probability and hypothesis-testing intuition.
- Week 4: Cleaning, transformations, pivot analysis, dashboards and presenting findings.
Create a sales and business performance dashboard in Excel.
02Month 2 · SQL and database analytics
- Database, DBMS/RDBMS, tables, types, primary/foreign keys, constraints and CRUD.
- SELECT, WHERE, sorting, aggregates, GROUP BY/HAVING, DISTINCT, LIKE/IN/BETWEEN, NULL handling and dates.
- CASE, subqueries, views, indexes, INNER/LEFT/RIGHT/FULL/self joins and multiple joins.
- CTEs, window functions, ROW_NUMBER/RANK/LAG/LEAD, running totals, moving averages, query optimisation and interview-style queries.
Analyse e-commerce sales, customers, products and revenue using joins, CTEs and window functions.
03Month 3 · Python for data analysis
- Python setup, variables, types, operators, control flow, loops, functions, modules, collections, file/CSV handling and exceptions.
- NumPy arrays, indexing, slicing, reshaping, stacking, splitting, mathematical/statistical functions, random numbers and linear algebra basics.
- Pandas Series/DataFrames, reading CSV/Excel, exploration, selection, missing values, groupby, merges, joins, transformations and apply.
- Exploratory data analysis and preparing datasets for visualisation.
Clean a messy dataset and produce a documented exploratory analysis.
04Month 4 · Visualisation and business intelligence
- Chart selection, visual design, colour, trends, comparisons and distributions in Excel and Python.
- Power BI data import, Power Query, transformations, modelling, relationships, DAX measures/calculated columns, slicers and drill-downs.
- Publishing/sharing reports, KPI dashboards, insight identification and stakeholder communication.
- Business storytelling frameworks, recommendations, project presentations and portfolio preparation.
Build and present an end-to-end business analytics dashboard.
05Months 5–6 · Projects and career preparation
- Requirement analysis, real datasets, cleaning, analysis, visualisation and interactive dashboards.
- Business impact, documentation and GitHub project submissions.
- Portfolio projects such as sales analytics, customer churn, e-commerce trends and healthcare analysis.
- ATS-friendly resume, LinkedIn, portfolio website, technical interviews, mock interviews, aptitude and job-search guidance.
Develop and present two to three substantial portfolio projects, with findings and recommendations.
LEARNING YOU CAN SHOW
Build your portfolio.
Tell your story.
Sales performance dashboard
E-commerce SQL analysis
Customer insights with SQL
Real-world data cleaning
Exploratory data analysis
Business intelligence dashboard
Final analytics portfolio
YOUR NEXT STEP
Take the roadmap with you.
Get the complete original brochure and connect with our team.
Curriculum based on the supplied EngineersCompass brochure. Batch timings, tool access, cloud/advertising budgets and completion conditions are confirmed at enrollment. External certification exams and employment are not guaranteed.